Cognitive Data for Digitalization
In a series of weekly short articles I’m discussing on LinkedIn some key ideas from recent talks I gave on the topic of Cognitive Data: https://www.slideshare.net/soeren1611/cognitive-data-122104948. Here you find the first three articles:
History of Computing
If we look back at the history of computing, we can see that IT technologies were initially very bound to the capabilities of the hardware, but became more intuitive and „human“ over the past decades:
- In the beginning (see the Zuse Z3 above), programmers had to physically interact with the technology via pushing and pulling registers or punch cards.
- In the 70ies and 80ies of the last century assembler programming became more prevalent, where you still interacted relatively close with the physical hardware, but at least it was not a physical exercise anymore.
- Computer Scientists then discovered, that there are more intuitive ways to interact with computers and got inspired by cooking recipes: functional/procedural programming of the 80ies and 90ies (remember PASCAL or C) basically resembled what cookbooks have done for centuries: describing the ingredients and a sequence of steps to realize a certain outcome.
- Even more intuitive was object-oriented programming in the 90ies and 2000er years, where large amounts of sourcecode was not expressed in lengthy spaghetti-code but organized intuitively in objects and methods. This programming paradigm can already be seen as being inspired how our brain sees the real world – we learned concepts of abstract objects (abstract entities such as cars, trees or buildings) and see their realization/instantiation in reality. Also, object have certain characteristics (size, color, shape) and functions, which correspond to data and methods associated with the objects.
This, however, is not the end of the development. The problem with object-oriented programming is that functions and methods are more dominant and the data is often deeply hidden in the code or in data silos where the structure of the data is only known to a few experts. We currently see that there is increasing attention to data (e.g. big data, smart data, data science) – data is becoming more and more a first class citizen of computing. Still many challenges are ahead of us to realize the vision of cognitive data. We need to find and use more intuitive representations of data, which capture their structure and semantics in machine and human comprehensible ways, so that we develop a common understanding of the data along use cases, organizations, applications, value chains or domains. Knowledge graphs, linked data and semantic technologies are good candidates in this regard.
The Neglected Variety Dimension
The three classic dimensions of Big Data are volume, velocity and variety. While there has been much focus on addressing the volume and velocity dimensions, the variety dimension was rather neglected for some time (or tackled independently). However, meanwhile most use cases, where large amounts of data are available in a single well-structured data format are already exploited. The music plays now, where we have to aggregate and integrate large amounts of heterogeneous data from different sources – this is exactly the variety dimension. The Linked Data principles emphasizing the holistic identification, representation and linking allow us to address the variety dimension. As a result, similarly as we have with the Web a vast global information system, we can build with the Linked Data principles a vast global distributed data space (or efficiently integrate enterprise data). This is not only a vision, but has started and gains more and more traction as can be seen with the schema.org initiative, Europeana or the International Data Spaces.
From Big Data to Cognitive Data
The three classic dimensions of Big Data are volume, velocity and variety. While there has been much focus on addressing the volume and velocity dimensions (e.g. with distributed data processing frameworks such as Hadoop, Spark, Flink), the variety dimension was rather neglected for some time. We have not only a variety of data formats – e.g. XML, CSV, JSON, relational data, graph data, … – but also data distributed in large value chains or departments in side a company, under different governance regimes, data models etc. etc. Often the data is distributed across dozens, hundreds or in some use cases even thousands of information systems.
The following figure demonstrates, that the breakthroughs in AI are mainly related to the data – while algorithms were devised early and are relatively old, only once suitable (training) datasets became available, we are able to exploit these AI algorithms.
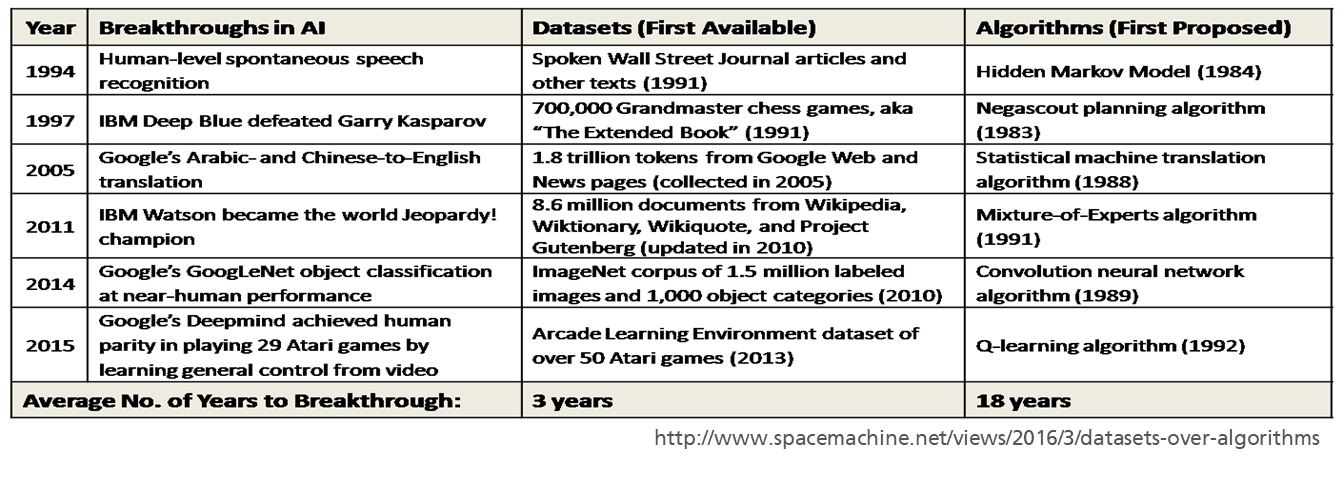
Another important factor of course is computing power, which thanks to Moore’s law, allows us to efficiently process after every 4-5 years data being a magnitude larger than before.
In order to deal with the variety dimension, we need a lingua franca for data moderation, which allows to:
- uniquely identify small data elements without a central identifier authority. This sounds like a small issue, but identifier clashes are probably the biggest challenge for data integration.
- map from and to a large variety of data models, since there are and always will be a vast number of different specialized data representation and storage mechanisms (relational, graph, XML, JSON and so on and so forth).
- allows distributed, modular data schema definition and incremental schema refinement. The power of agility and collaboration became meanwhile widely acknowledged, but we need to apply this for data and schema creation and evolution.
- deal with schema and data in an integrated way, because what is a schema from one perspective turns out to be data from another one (think of a car product model – its an instance for the engineering department, but the schema for manufacturing).
- allows to generate different perspectives on data, because data is often represented in a way suitable for a particular use case. If we want to exchange and aggregate data more widely, data needs to be represented more independently and flexibly thus abstracting from a particular use case.
The Linked Data principles (coined by Tim Berners-Lee) allow us to exactly deal with these requirements:
- Use Universal Resource Identifiers (URI) to identify the “things” in your data – URIs are almost the same as the URLs we use to identify and locate Web pages and allow us to retrieve and link an the global Web information space. We also do not need a central authority for coining the identifiers, but everyone can create his own URIs simply by using a domain name or Webspace under his control as prefix. „Things“ refers here to any physical entity or abstract concept (e.g. products, organizations, locations and their properties/attributes etc.)
- Use http:// URIs so people (and machines) can look them up on the web (or an intra/extranet) – an important aspect is that we can use the identifiers also for retrieving information about them. A nice side effect of this is that we can actually verify the provenance of information by retrieving the information about a particular resource from its original location. This helps to establish trust in the distributed global data space.
- When a URI is looked up, return a description of the thing in the W3C Resource Description Format (RDF) – as we have a unified information representation technique on the Web with HTML, we need a similar mechanism for data. RDF is relatively simple and allows to represent data in a semantic way and to moderate between many different other data models (I will explain this in next weeks article).
- Include links to related things – as we can link between web pages located on different servers or even different ends of the world, we can reuse and link to data items. This is a crucial aspect to reuse data and definitions instead of recreating them over and over again and thus establish a culture of data collaboration.
As a result, similarly as we have with the Web a vast global information system, we can build with these principles a vast global distributed data management system, where we can represent and link data across different information systems. This is not just a vision, but currently already stared to happen, some large scale examples include:
- the schema.org initiative of the major search engines and Web commerce companies, which defined a vast vocabulary for structuring data on the Web (and is used already on a large and growing share of Web pages) and uses GitHub for collaboration on the vocabulary
- Initiatives in the cultural heritage domain such as Europeana, where many thousands of memory organizations (libraries, archives, museums) integrate and link data describing the artifacts.
- the International Data Spaces Initiative, aiming to facilitate the distributed data exchange in enterprise value networks thus establishing data sovereignty for enterprises.
Representing Knowledge in Semantic Graphs
For representing knowledge in graphs we need two ingredients, unique identifiers and a mechanism to link and connect information from different sources. Universal Resource Identifiers (URIs) and subject-predicate-object statements according to the W3C RDF standard allow exactly this. As we can build long texts out of small sentences, we can build large and complex knowledge graphs from relatively simple RDF statements. As a result, knowledge graphs can capture the semantics and meaning of data and thus lay the foundation for a data innovation architecture, as it is increasingly used in enterprises and larger organizations.
Representing Data Semantically
Let us look at the Linked Data principles (coined by Tim Berners-Lee):
- Use Universal Resource Identifiers (URI) to identify the “things” in your data.
- Use http:// URIs so people (and machines) can look them up on the web (or an intra/extranet).
- When a URI is looked up, return a description of the thing in the W3C Resource Description Format (RDF).
- Include links to related things.
Now, we want to look at how we can represent data semantically, so it can capture meaning, represent a common understanding between different stakeholders and allows to interlink data stored in different systems.
Identifying things
The basis of semantic data representation are URIs – Universal Resource Identifiers. Similarly as every Web page has its URL (which you can see in the location bar of your browser), URIs can identify every thing, concept, data item or resource. Here are some examples of some URIs:
- http://dbpedia.org/resource/LinkedIn – identifier for the entity LinkedIn (as described on the Wikipedia page)
- http://schema.org/Organization – identifier for the concept organization from the schema.org vocabulary
- http://xmlns.com/foaf/spec/#term_lastName – identifier for the last name of a person from the FOAF vocabulary
Everyone (who has a domain name or webspace) can coin its own URIs, so you do not rely on a central authority (e.g. GS1, ISBN) as with other identifier systems. Since every URI contains a domain name, information about the provenance and the authority coining the URI is built in the identifier. It is important to note, that these URI identifiers can point to any concept, thing, entity, relationship, being it physical/real or abstract/conceptual.
Representing Knowledge
Once we have a way to identify things, we need a way to connect information. The W3C standard RDF, follows simple linguistic principles: the key elements of natural language (e.g. English) sentences are subject, predicate and object. The following subject-predicate-object triple for example encodes the sentence „InfAI institute organizes the Leipzig Semantic Web Day 2018“:

As you can see, we use an identifier http://infai.org for „InfAI institute“, http://conf-vocab.org/organizes for the predicate „organizes“ and http://infai.org/LSWT2018 as identifier for the object of the sentence „Leipzig Semantic Web Day 2018“. As we connect sentences in natural language by using the object of a sentence as subject of further sentence, we can add more triples describing LSWT2018, for example, in more detail, by adding the start day and the location:

As you can see in this example, a small knowledge graph starts to emerge, where we describe and interlink entities represented as nodes. You can also see, that we can mix and mesh identifiers from different knowledge bases and vocabularies, e.g. here the predicates from a conference vocabulary and the location referring to the DBpedia resource Leipzig. The start date of the event is here not represented as a resource (having an identifier), but as a Literal – the RDF term of a data value, which can have various data types (e.g. string, date, numbers).
Knowledge Graphs
Build on these simple ingredients, we can build arbitrary large and complex knowledge graphs. Here is an example graph describing a company:

A knowledge graph now is a fabric of concept, class, property, relationships, entity descriptions, which uses a knowledge representation formalism (typically RDF, RDF-Schema, OWL) and comprises holistic knowledge covering multiple domains, sources and varying granularity. In particular:
- instance data (ground truth), which can be open (e.g. DBpedia, WikiData), private (e.g. supply chain data) or closed data (product models) and derived, aggregated data,
- schema data (vocabularies, ontologies) and meta-data (e.g. provenance, versioning, documentation licensing) as well as comprehensive taxonomies to categorize entities
- links between internal and external data and mappings to data stored in other systems and databases
Meanwhile a growing number companies and organizations (including Google, Thompson Reuters, Uber, AirBnB, UK Parliament) are building their knowledge graphs to connect the variety of their data and information sources and build an data innovation ecosystem.
Resources
There are some resources you might want to have a look at:
- The full slide deck of my cognitive data presentation: https://www.slideshare.net/soeren1611/cognitive-data-122104948 and a recording of a recent talk at OSLCfest can be found here: https://www.facebook.com/oslcfest/videos/2261640397437958/
- Information about research and development in the context of cognitive data at TIB (including projects such as BigMedilytics and BOOST4.0): https://www.tib.eu/en/research-development/
- The International Data Space implements some of the ideas for cognitive data in its reference architecture.
- The Semantic Data Web lecture series I’m regularly teaching at Leibniz University of Hannover.